-
Data Prepare
(1) Prepare a color (value) array and a size array in Python. They can be either
listornumpy.ndarrayinstances.(2) Call the
build_txt()function inutils.pyto easily generate a .node file with160rows and6columns. Elements in one row are split by space. Each element can be an integer or float number.Example: file
output/example.node. -
Launch BrainNet Viewer in MATLAB
(1) In MATLAB, open BrainNetViewer/BrainNet.m. Then run it.
>> BrainNet
Please cite:
Xia M, Wang J, He Y (2013) BrainNet Viewer: A Network Visualization Tool for Human Brain Connectomics. PLoS ONE 8: e68910.
An example:
'The brain networks were visualized with the BrainNet Viewer (http://www.nitrc.org/projects/bnv/) (Xia et al., 2013)'.

(2) Then in BrainNet Viewer, click File > Load File. In "Surface file", browse and choose "./data/surface.nv"; in "Node file", browse and choose the node file you just generated (example: "./output/example.node"); leave the rest two fields blank. Click "OK".

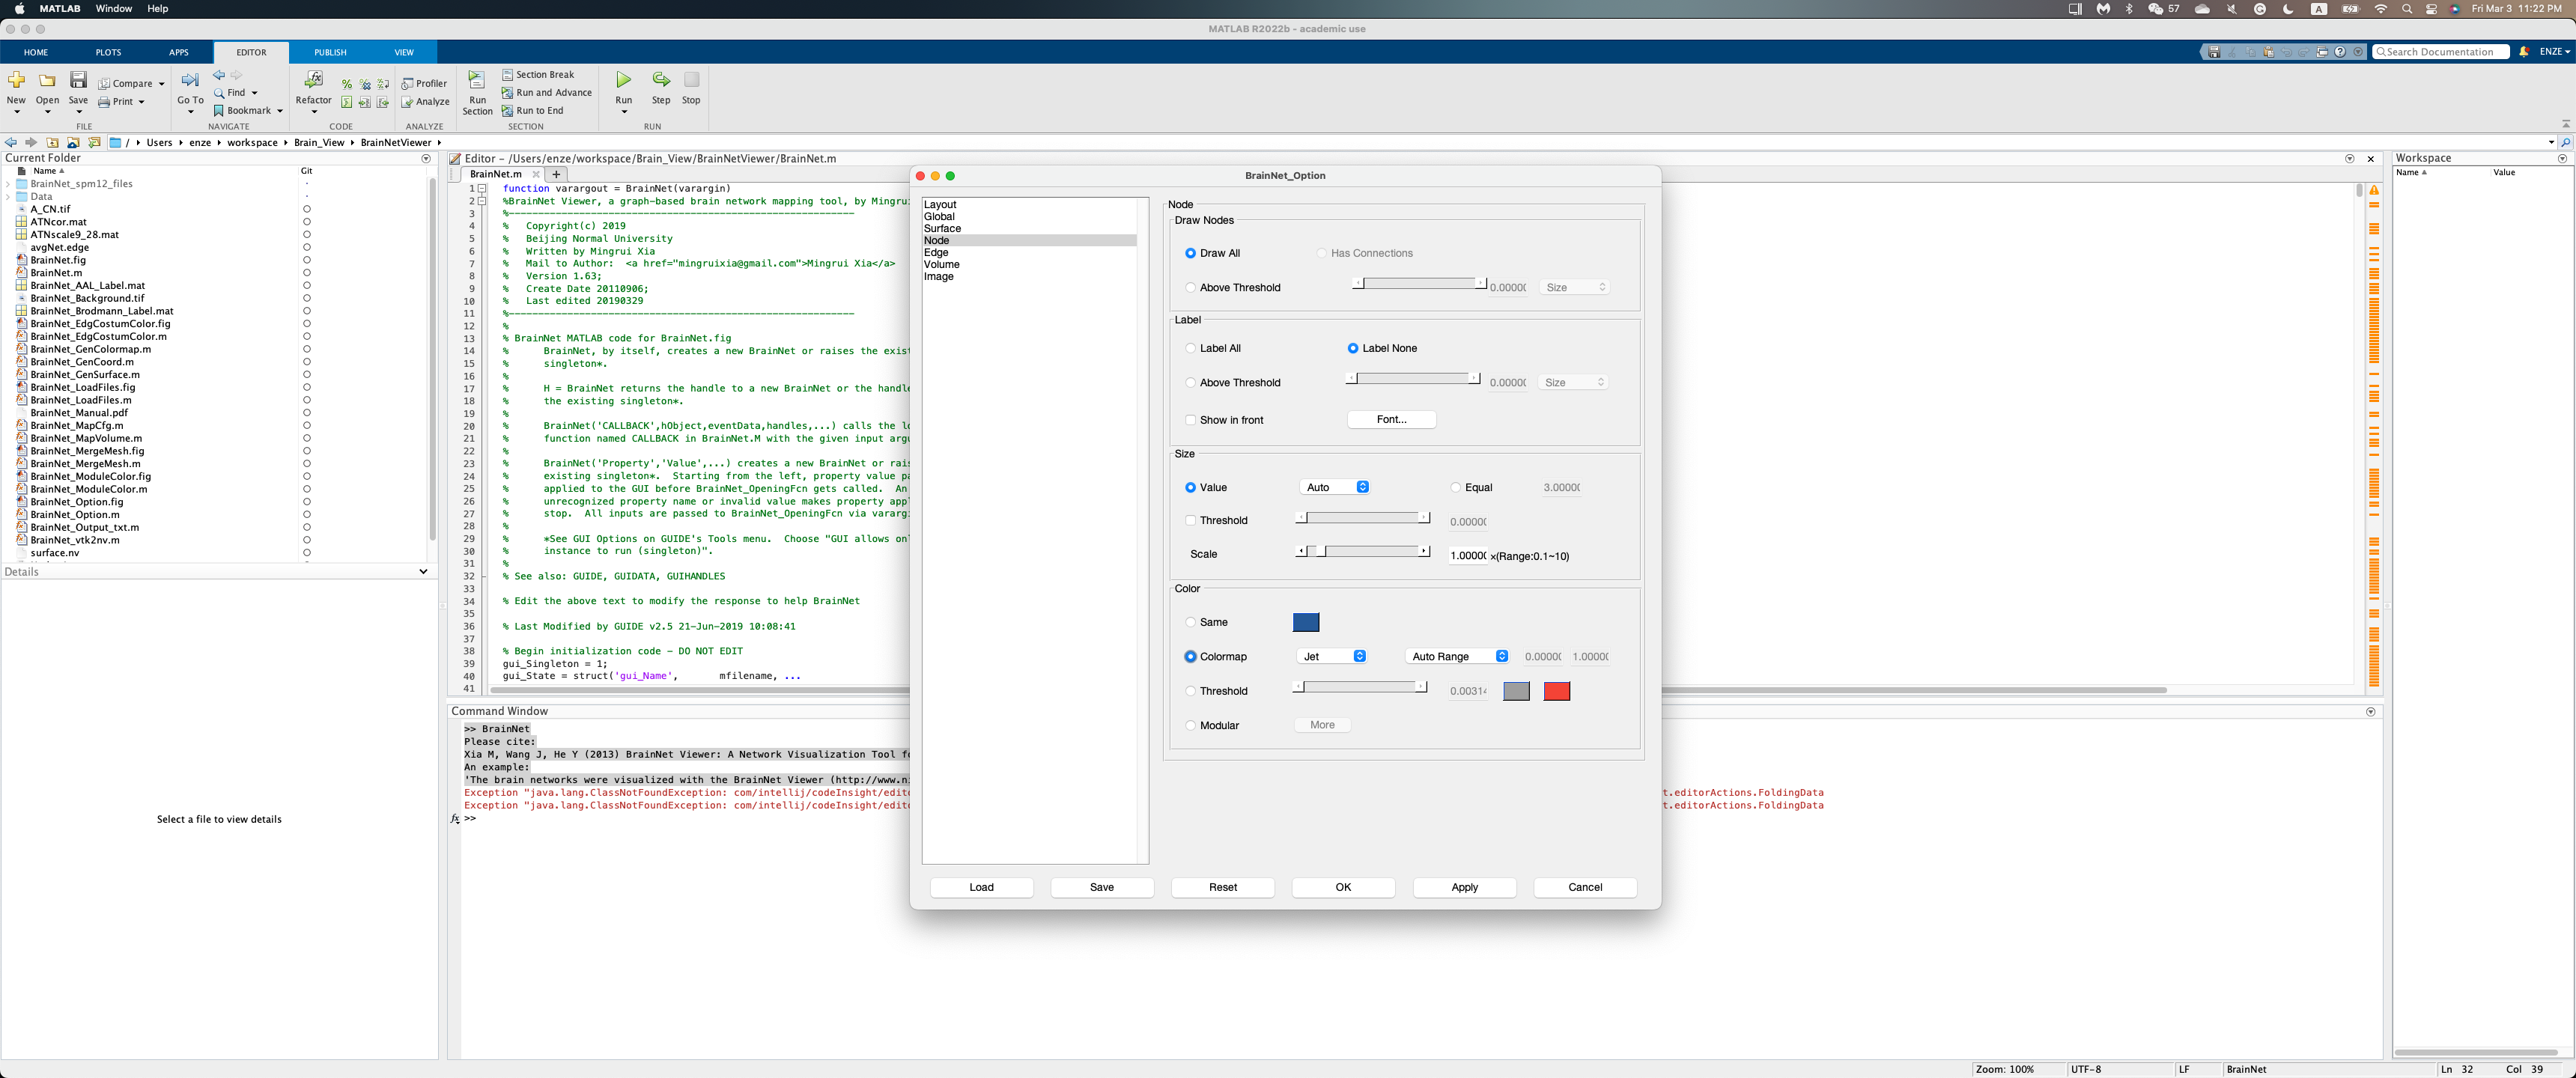
(3) You may modify the settings under the left-side tabs. (Typically, you can modify the color and size features under the "Node" tab. Here, for example, we set Node > Color > Colormap to "Jet"). Then click "OK".
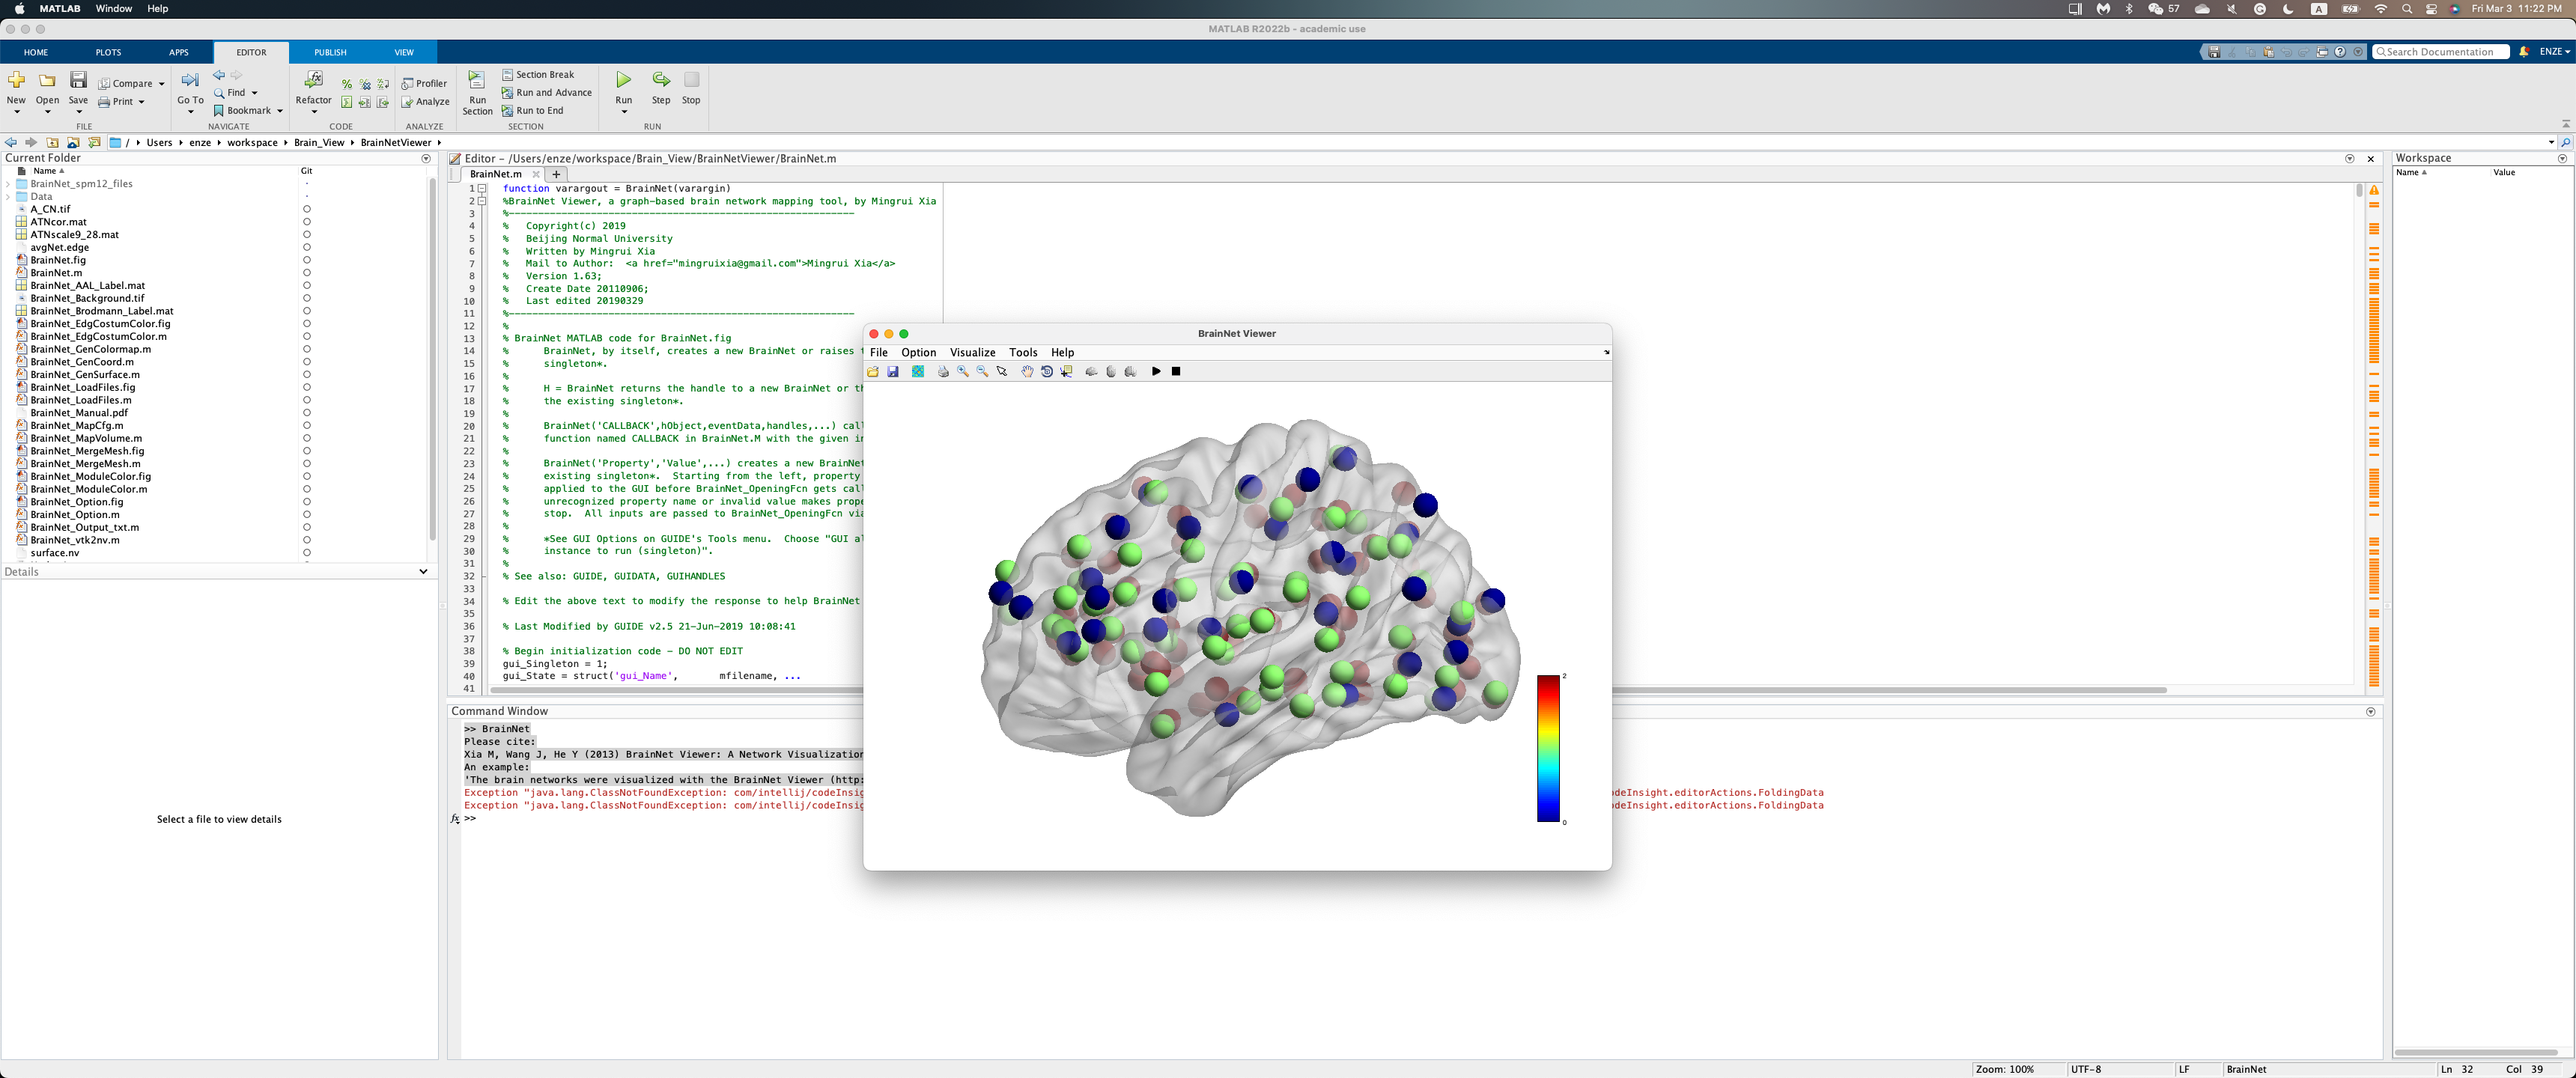
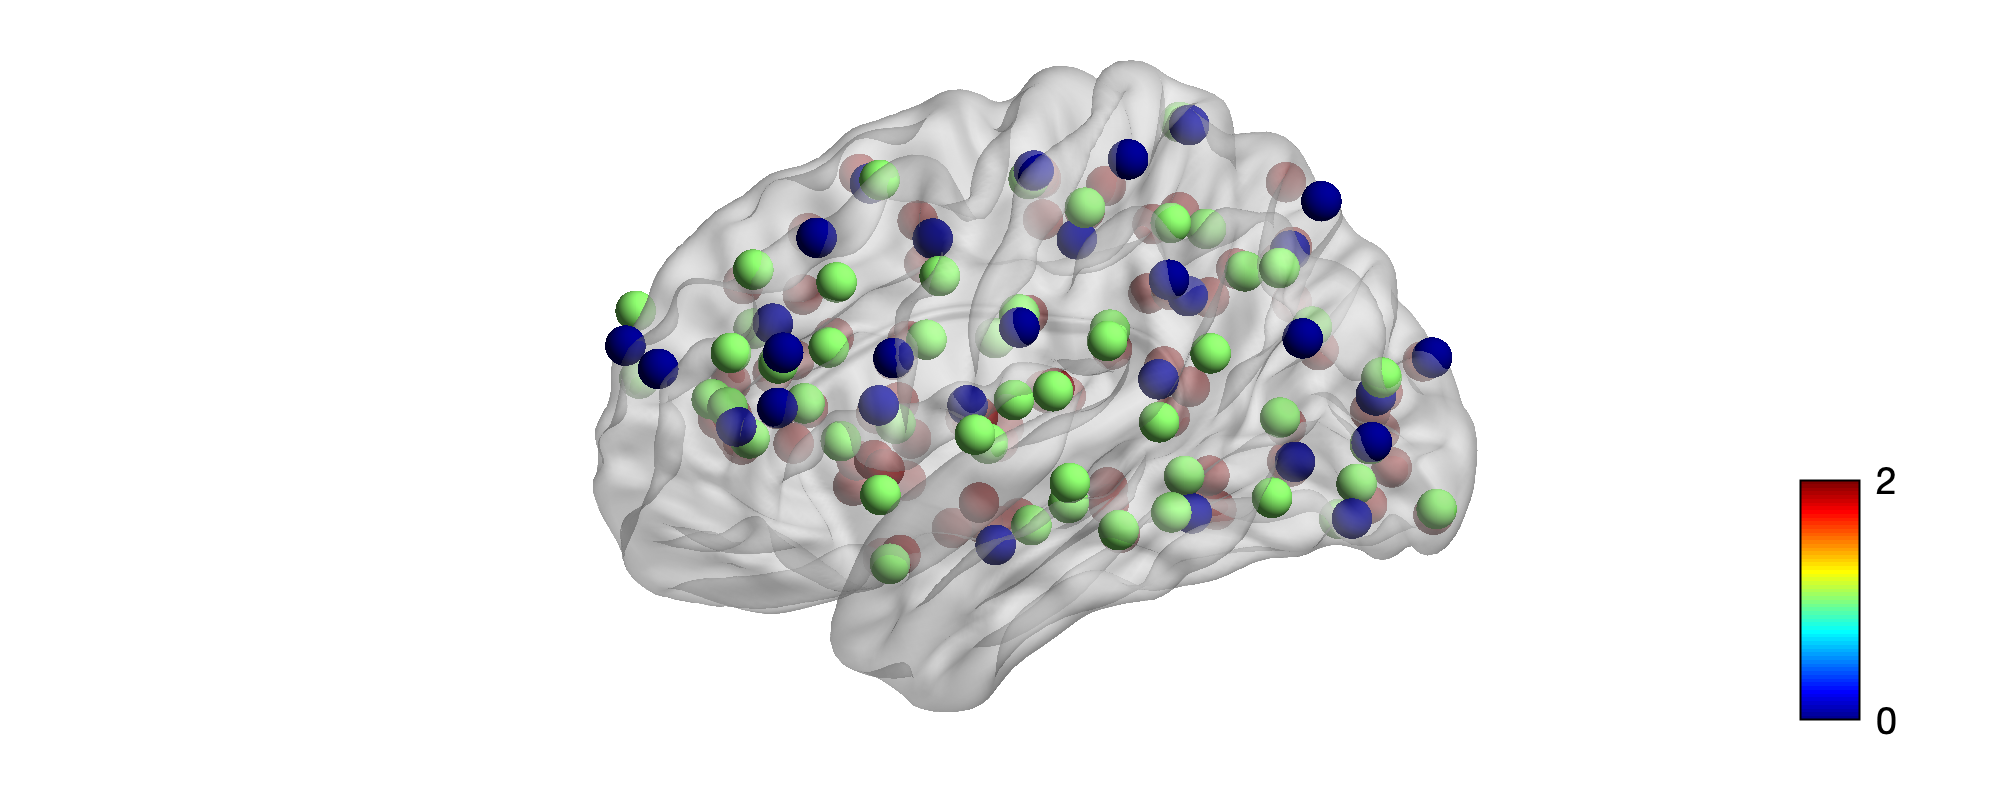
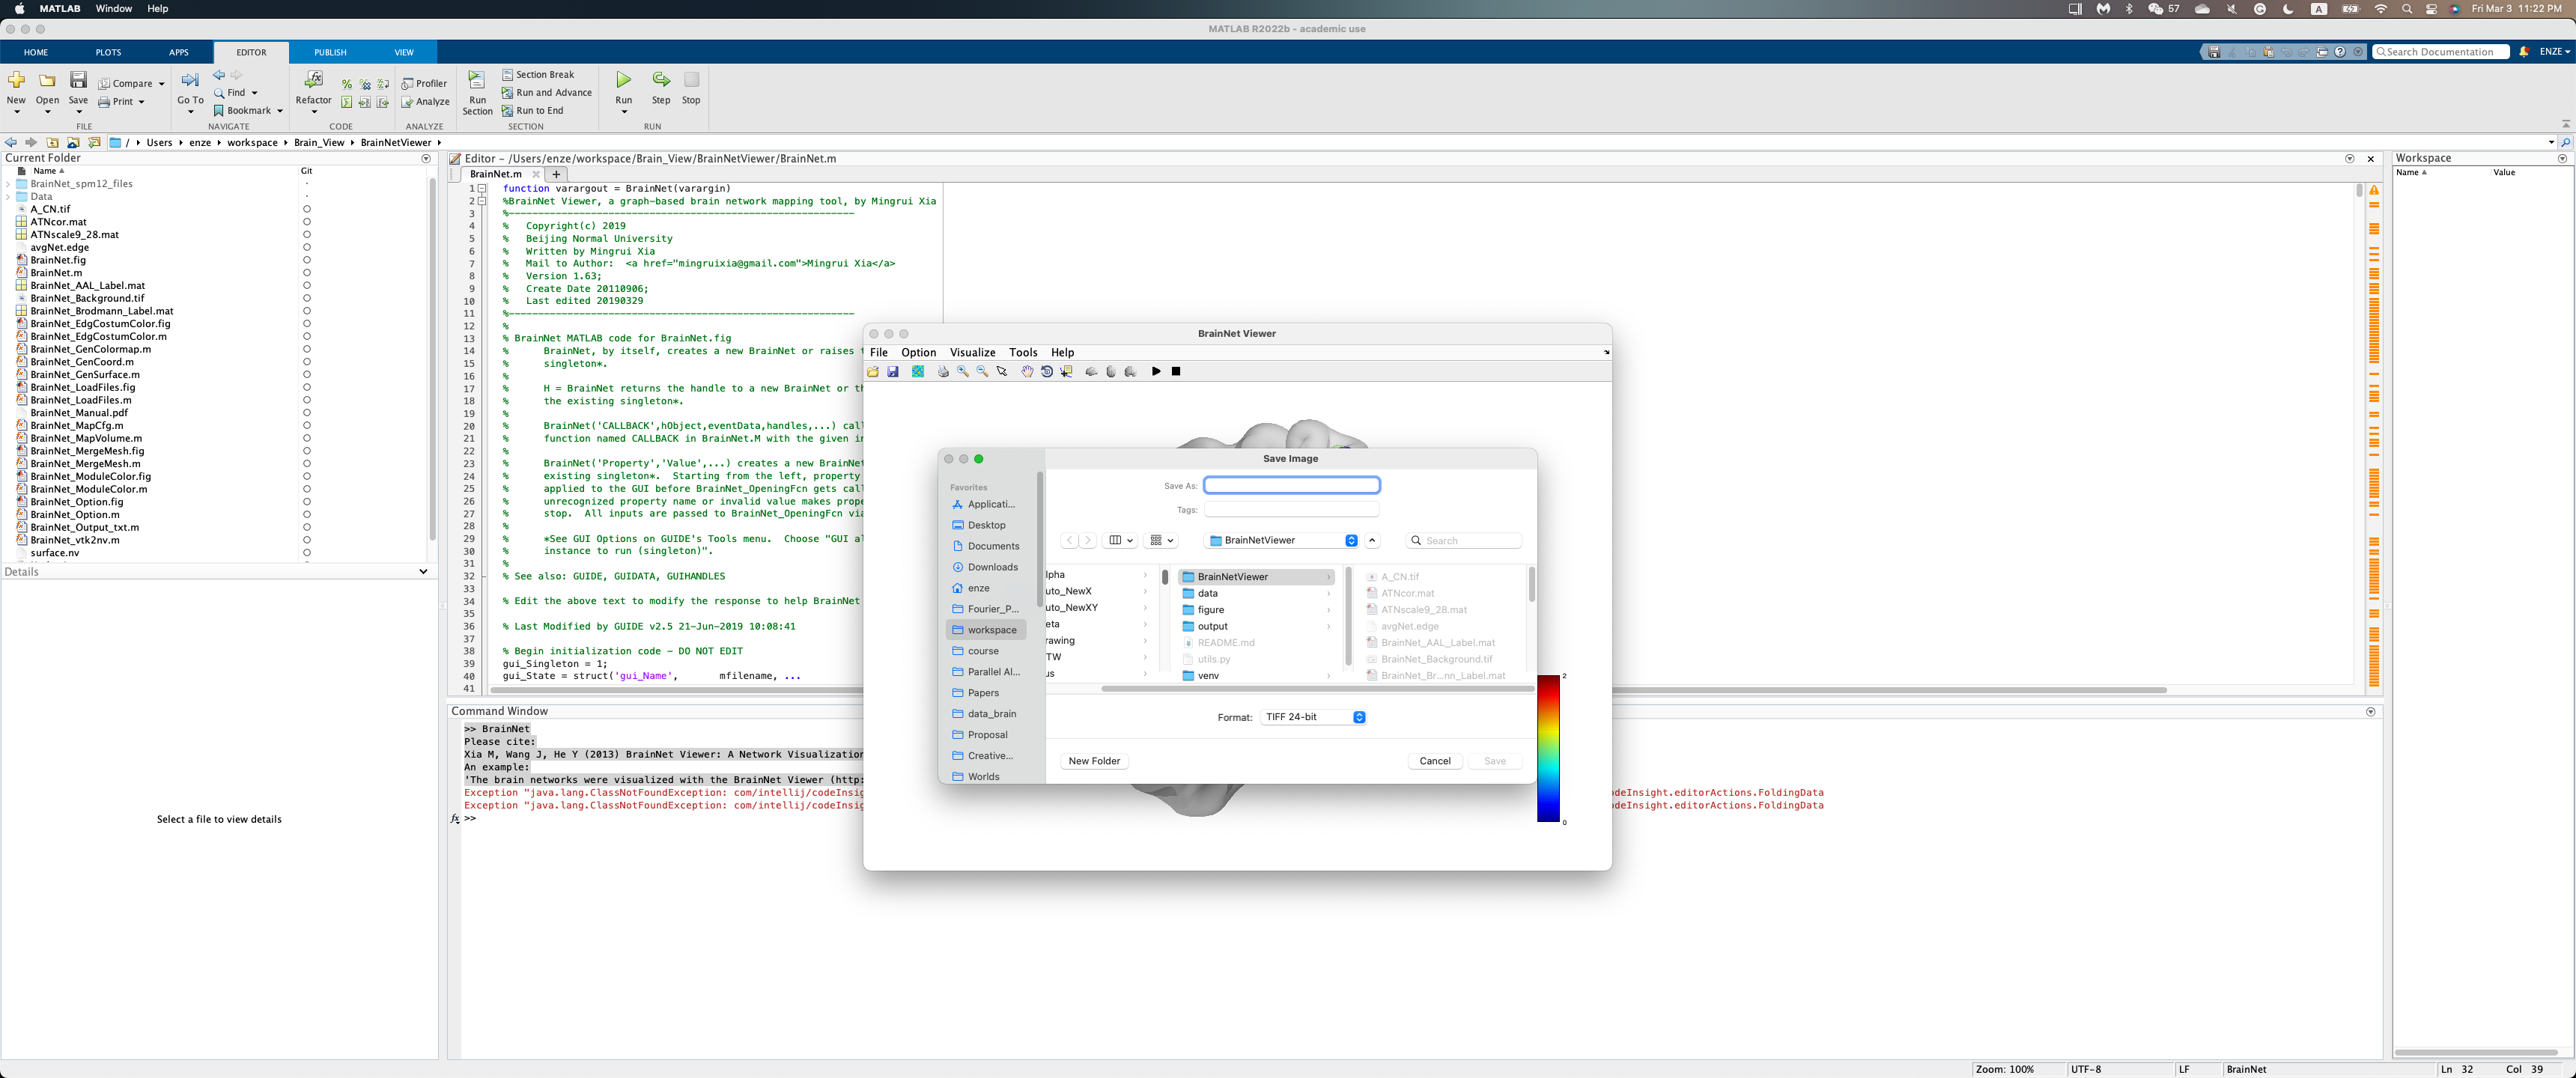
(4) Click "Save Figure" to save the generated brain view plot. (In the example case, since the size array are set the same, we have balls in the figure with the same size)
-
Install MATLAB (Optional)
Wake Forest students have free access to download and use MATLAB. To learn more, please visit https://software.wfu.edu/download/matlab/.
Please email chenm@wfu.edu